
In this article, we will discuss how to build a highly scalable real-time network monitoring system with eBPF & XDP. We will also discuss the challenges we faced while building this system and how we overcame them.
Introduction
As the industry is shifting towards cloud-native applications, the network traffic is also increasing. This increase in network traffic is causing a lot of challenges for network engineers. They are facing challenges like:
- Network monitoring is becoming difficult
- Network engineers are not able to identify the root cause of the network issues
- Network engineers are not able to identify the network issues in real-time
- Network engineers are not able to identify the network issues at scale
Industry 4.0 aims at increasing the efficiency of the manufacturing process. It is also known as the fourth industrial revolution. The fourth industrial revolution is also known as the smart factory. The smart factory is a factory that uses advanced technologies to increase the efficiency of the manufacturing process. The smart factory uses technologies like:
- Internet of Things (IoT)
- Artificial Intelligence (AI)
- Machine Learning (ML)
- Big Data
- Cloud Computing
In order to meet the requirements of the smart factory, the next-generation network monitoring systems should also be able to provide real-time network monitoring at scale. The next-generation network monitoring systems should also be able to provide network monitoring at the required level of granularity. The next-generation network monitoring systems should also be able to provide network monitoring at the required level of accuracy.
Related Work
In this section, we will discuss the related work that facilitated this project. We will also discuss the challenges that are faced by the existing solutions.
the extended Berkeley Packet Filter (eBPF)
The Berkeley packet filter eBPF is a recent technology available in the Linux kernel, which extends the user capabilities to control kernel-level activities. It is an instruction set and an execution environment inside the Linux kernel, enabling modification, interaction, and kernel programmability at runtime. The eBPF-based packet tracing is utilized for monitoring tasks and network traffic in real-time. Although it is commonly used for building proof-of-concept applications, it has proven to be challenging to extend those applications to more complex functionality due to its limitations (Miano et al., 2018). eBPF allows user-space applications to inject code in the kernel at runtime, i.e., without recompiling the kernel or installing any optional kernel module. This results in a more efficient system.
The next figure shows the flow of eBPF programs from execution at user-space to the injection of network tracing points inside the kernel.
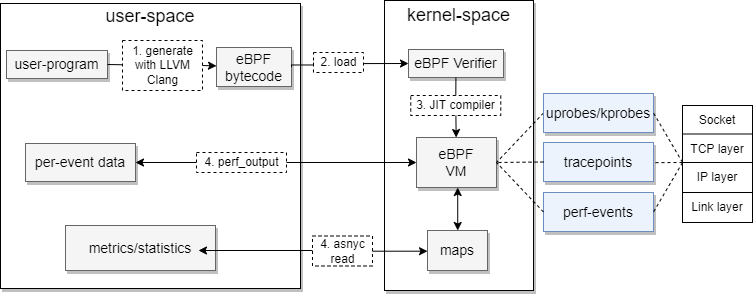 eBPF program flow
The eBPF program gets compiled using Low-level virtual machine (LLVM) compiler and then attempts to load the compiled eBPF bytecode into the kernel after passing eBPF verification process first. The eBPF context runs then inside the eBPF virtual machine. The eBPF program is triggered on an event by attaching hooks in the kernel. These hooks are:
- tracepoint: Similar to breakpoints, but instead of stopping execution when a breakpoint is hit, log information are collected for debugging reasons. Tracepoints are static locations in the kernel, e.g. disk IO operations.
- kprobes: Similar to tracepoints, but instead of logging information, the execution is stopped and the eBPF program is executed. Kprobes are dynamic locations in the kernel, e.g. TCP connection establishment.
- kretprobes: Similar to kprobes, but instead of stopping the execution, the eBPF program is executed after the execution of the function is completed.
- uprobes: Similar to kprobes, but instead of stopping the execution, the eBPF program is executed when the function is called from user-space.
- perf events: Similar to tracepoints, but instead of logging information, the eBPF program is executed when a perf event is triggered.
The extended datagram packet interface (XDP)
The eXpress data path XDP is fast programmable packet processing framework in the operating system’s kernel. It is the lowest layer of Linux network stack. It allows installing programs that process packets into the Linux kernel. These programs will be called for every incoming packet.
 XDP packet processing overview
Packet filtering in Linux machines
Packet filtering is a basic layer of security for networks that controls which traffic is allowed to pass through. By allowing or denying certain packets, packet filtering can help protect networks from unauthorized access and attacks. Packet filtering can be done at different stages on a network, from the physical interface to the application. (Scholz et al., 2018) divides packet filtering into four levels, from the lowest in abstraction to the highest:
- Hardware layer: This is the lowest level of packet filtering. It is done by the network interface card (NIC) and is the first line of defense against malicious traffic. It is the most efficient way to filter packets, but it is also the most limited in terms of functionality.
- Network layer: This is the second level of packet filtering. It is done by the network stack of the operating system. It is more flexible than the hardware layer, but it is also less efficient.
- System layer: This is the third level of packet filtering. It is done by the system’s firewall. It is more flexible than the network layer, but it is also less efficient.
- Application layer: This is the highest level of packet filtering. It is done by the application. It is the most flexible, but it is also the least efficient.
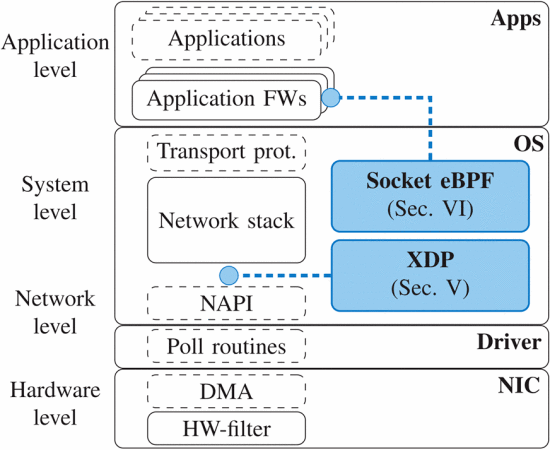 Layers of packet filtering
The work of (Bertrone et al., 2018) showed that packet filtering with \ac{EBPF} has significant performance benefits over standard OS tools such as IPTables. This reduces the computational overhead and bandwidth consumption. Packet filtering is important in monitoring deterministic RT networks because it allows for the inspection of packets as they are transmitted on the network, helping to reduce resources overhead due to unnecessary packets or redundant requests.
 Packet filtering performance comparison
Additionally, packet filters can identify any issues that may occur with the transmission of packets, helping to ensure that the network remains operational and that data is transmitted accurately. However, no implementations of RT network monitoring systems that focus on OS processes such as packet filtering are currently available.
System design
The next figure shows the system design of our real-time network monitoring system as a blackbox.
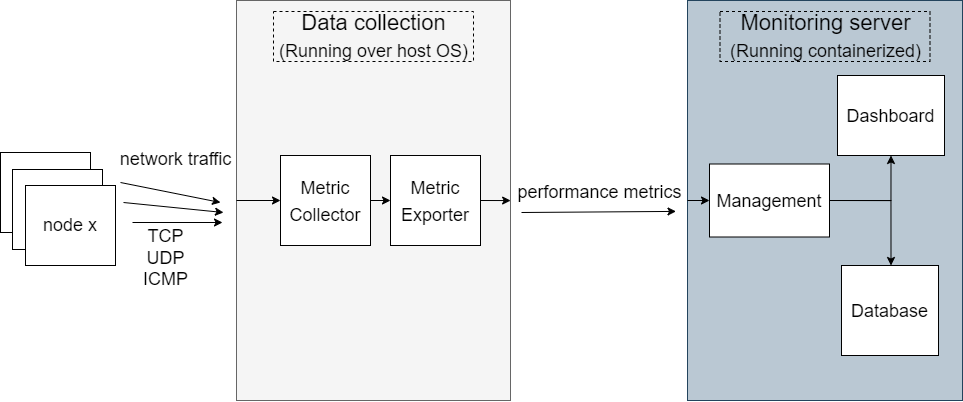 The monitoring system as a blackbox
In our approach, the monitoring system is composed of four abstract layers following (Lee et al., 2014)’s work. The first one is the collection layer. This layer collects measurements from the network when new events occur, pre-processes and standardizes them. The second layer is called reporting. In this layer, measurement data are exported after collection and consumed asynchronously by administrative entities through data exporters. The third layer is where data is managed, stored, and measurements are checked for integrity. Lastly, the presentation layer represents how the user interacts with the system.
According to (Lee et al., 2014), It is easier to monitor network through visual representations, rather than through numerical data. This is because it is easier to identify issues and potential problems when they are represented visually. Additionally, it can be helpful to see how data flows through the network, and where congestion for instance is occurring.
 Sequence diagram of the monitoring funcionality from data collection to visualization
Software Design
The implementation consists of two main modules: the DataAggregator and the DataVisualizer. The DataAggregator consists of four components: the MetricCollector, PacketSampler, XDP-packetDrop, and DataExporter. The DataVisualizer also consists of four components: MonitoringServer, Visualization, Database, and MetricsExporter.
The DataAggregator module collects network metrics and the DataVisualizer module represents them in a dashboard. The DataVisualizer also has the ability to bind MetricsExporter services, which allows for the export of metrics to third-party services.
Both modules are scalable and flexible, as they can be deployed on any host machine.
Real-time data collection
The implementation of the MetricCollector uses eBPF tracing programs in a sandbox inside the kernel. These programs inject tracing points in the Linux kernel to track network events and are triggered on events, such as TCP connections, and process creations. eBPF programs allow reading the collected measurements from the user space, either by sending details per event or by accumulating the data and passing them via the BPF map asynchronously. BPF maps can support arrays, associative arrays, and histograms, and are suitable for passing summary statistics. The next figure illustrates how the eBPF program collaborates with the DataExporter to publish real-time network measurements from the kernel-space. These two components work in parallel.
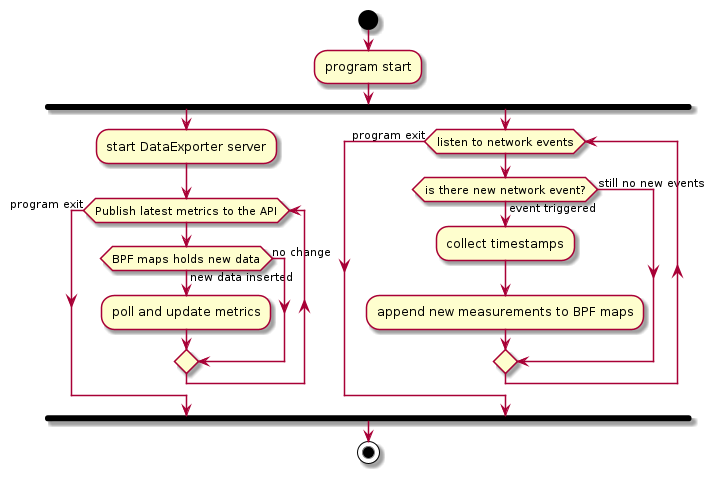 eBPF packet filtering and data exporting activity diagram
There is a variety of programming languages and frameworks to create eBPF programs, one of which is BCC. BCC is a library used to create Berkeley Packet Filter (eBPF) programs that analyze network and OS performance without incurring overhead or posing security threats. BCC eliminates the necessity for users to know deep technical details about eBPF, and provides many ready-to-use starting points, such as the bcc-tools package containing pre-created eBPF programs. Additionally, BCC offers a Clang compiler capable of compiling BPF code at runtime, which facilitates development of maintainable BPF applications designed to be compatible with kernel changes. BCC allows writing eBPF programs in many languages such as C, C++, Python, Lua and go.
Active probing
Active probing is necessary to fill the gaps when less information about the network status is available because of lower traffic volume, as Lee’s work states. Active probing is essential in order to guarantee up-to-date real-time monitoring capabilities. Active probing is done by the PacketSampler. The MetricCollector informs the PacketSampler to create probe packets and send it to host node similar to pinging via ICMP packets. The MetricCollector collects network measurements such as latency, RTT, and jitter of the packets sent by the PacketSampler and the acknowledgment received back. These packets can be then dropped by the XDP-packetDrop component to save bandwidth within the network stacks and hardware resources by reducing the number of context switches in CPU.
Real-time data exporter
The DataExporter publishes up-to-date network metrics ready for external service to scrape asynchronously. The DataExporter uses Prometheus open source Monitoring framework to expose the metrics. Prometheus has a large ecosystem of off-the-shelf exporters. Prometheus exporters provide an interface between Prometheus and applications that don’t export metrics in the Prometheus format. A good example is the node exporter, which exposes Linux metrics in Prometheus format. Another popular example is cAdvisor, which exports metrics from containers. An external service such as a Prometheus monitoring server reads the metrics exposed by the target using a simple text-based exposition format. When no exporter that fits the application needs is found, Prometheus provides client libraries that can be used to develop a custom exporter that translates the metrics in Prometheus format. There are official client libraries in go, python, java, and ruby. Additional unofficial client libraries for other programming languages can be also found here.
Here’s a pseudo example of writing a custom exporter in python:
1
2
3
4
5
6
7
8
9
10
11
from prometheus_client import Gauge

latencyGauge = Gauge('tcp_connlat_msec', 'tcp connection latency',['saddr', 'daddr'] )

define BPF program context

attach probes to kernel

def run_ebpfProgram():
    while True:
        poll new measurements
The metrics will then be exposed at a specific port. The published metrics are updated in real time every time the page is reloaded. Below is an example output of the format of the published metrics
1
2
3
4
5
6
7
metric_x{destination_ip, source_ip"} 25.383
metric_y{destination_ip, source_ip"} 0.106
# metrix_z as a counter
metric_z 397
.
.
.
Visualization
The visualization module is a combination of Prometheus server, Grafana, and database in a multi-container application. Docker-compose defines the protocol and communication between the containers. Additional metrics exporters can be implemented whether in the same docker-compose file containing the DataVisualizer module or externally and binded later with the monitoring server represented in Prometheus server. The endpoint host docker.internal exports the collected metrics from the eBPF-based implementation and exposes it to docker containers to scrape from the host machine
The MonitoringServer component stores the polled metrics from the DataExporter menitoned earler in a realational database suitable for time series using HTTP pulls. The MonitoringServer also has basic visualization service over its dashboard. Grafana service representing the Visualization component requests the stored metrics from the MonitoringServer and provides various, more advanced charts, flexible queries, realtime alerts, and other features through user-interface. Three sub-parts make up the MonitoringServer: Storage management, data retrieval, and a user-friendly dashboard as visualized below.
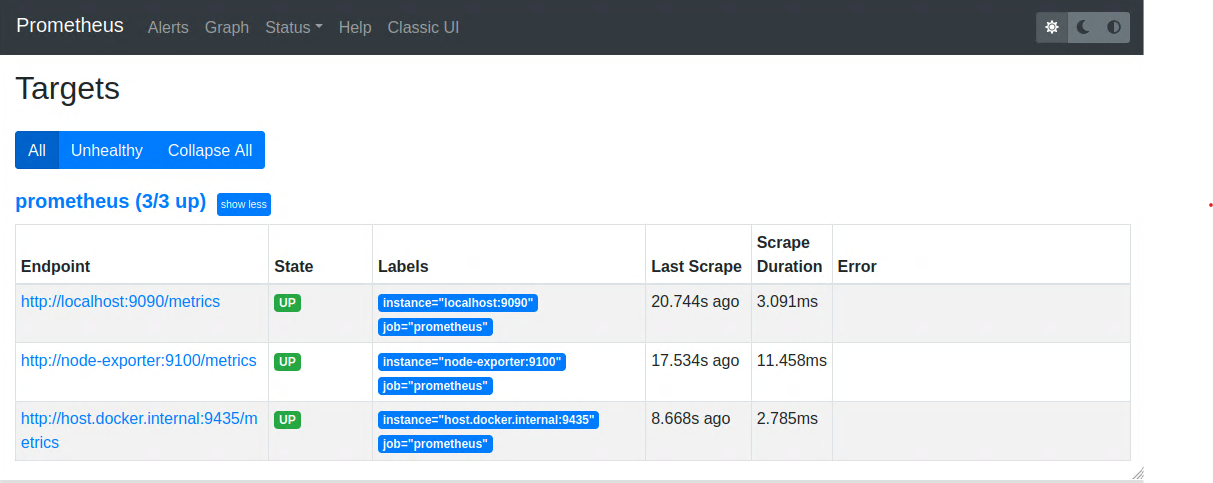 Prometheus dashboard showing all connected resources of metrics
The visualization module combines Prometheus and Grafana services as their underlying MonitoringServer component. Prometheus processes, stores, queries real-time and long term metrics data while Grafana provides a powerful and flexible dashboards and data visualization solution for data aggregated in Prometheus. Furthermore, the database component for this module is a persistent temporal database. This module has the ability to export collected metrics to third-party applications.
 Grafana dashboard with example graphs plotting real-time data
Grafana is an open-source analytics and interactive visualization tool. It provides web charts, graphs, and alerts based on data from supported sources. Grafana comes with a built-in MySQL data source plugin. This allows the user to easily design graphs by querying and visualizing data from MySQL compatible databases.
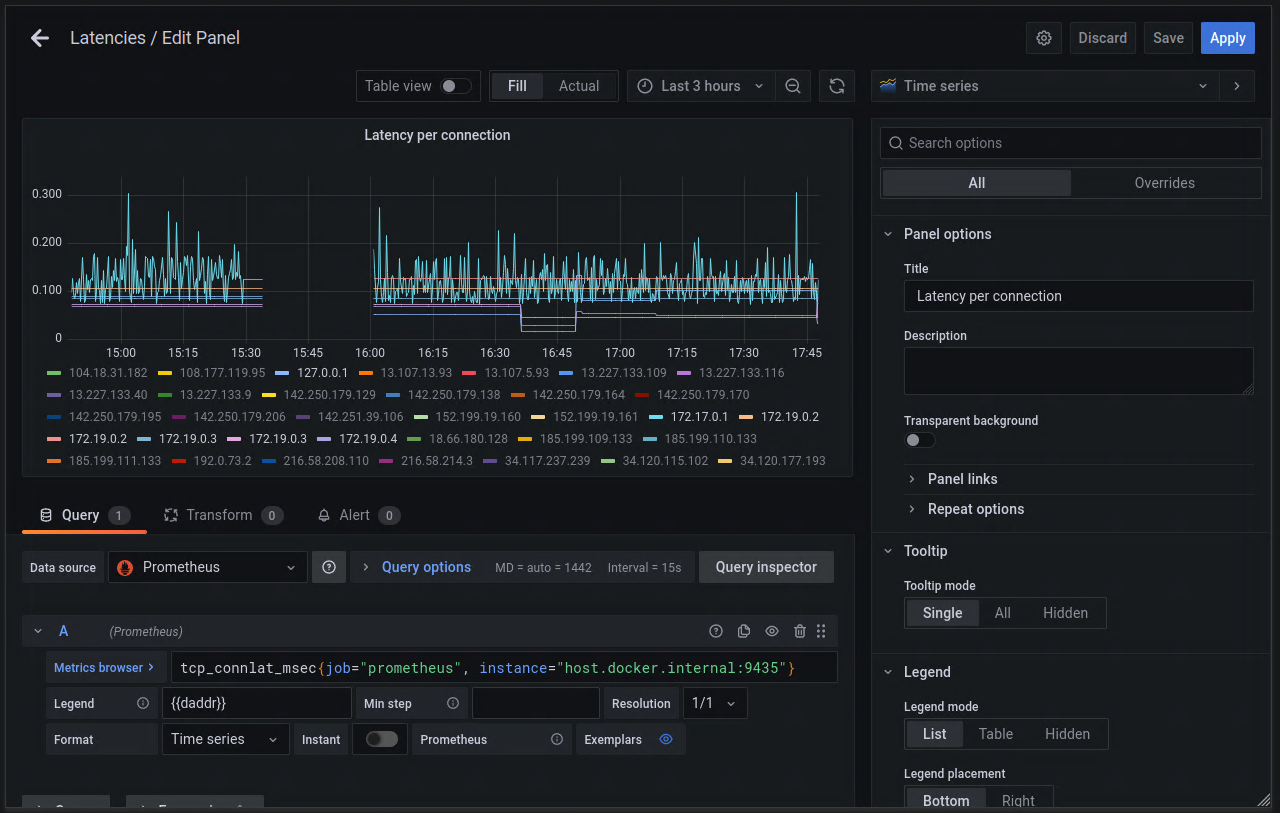 Creating a new panel in Grafana
Evaluation
In this section, a performance test of the implemented software is carried out on three different testbed setups. These are, GCP, docker, and a real network consisting of devices connected to a router. The GCP node consists of a single VM with 2 cores and 4GB of RAM. The docker node consists of a single docker container with 1 core. The real network testbed consists of n devices connected to a router. The performance test is done to evaluate if the software provides better performance and less resource consumption. A comparative analysis of the performance of the implemented software with similar tools that do not use eBPF in packet filtering is done. In this analysis, the following factors are considered:
- The time taken by the software to execute the task.
- The amount of memory consumed by the software.
- The amount of CPU utilization by the software.
An evaluation testbed consisting of n virtual machines on Google Cloud Service Provider (GCP) is created with the capability of adding more instances to the testbed. The preparation of the testbed over GCP is briefely explained in the following code block:
1
2
3
4
5
6
7
8
9
10
11
12
13
14
15
16
17
18
19
20
21
22
23
24
25
#!/bin/sh

# initial variables
USER_NAME='testbed'
TAG='testbed_network'
INSTANCE_NAME='testbed-instance'

# create ssh key pair and add it to GCP account
echo -e 'y\n' | ssh-keygen -f id_rsa -C $USER_NAME
echo -n $USER_NAME":$(cat id_rsa.pub)" > $METADATA_FILE
gcloud compute project-info add-metadata --metadata-from-file ssh-keys=$METADATA_FILE

# create the firewall rule for ssh and icmp
gcloud compute firewall-rules create allow-ssh-icmp-rule --network default --action allow --direction ingress,egress --rules tcp,icmp --source-ranges=0.0.0.0/0 --target-tags $TAG

# create 3 instances in the same network
for num in $(seq 1 3);
do
    gcloud compute instances create $INSTANCE_NAME$num --zone=europe-west3-c --machine-type n2-standard-2 --image-project ubuntu-os-cloud --image-family ubuntu-1804-lts --tags $TAG
    # resize disk space of the created instance
    echo 'y' | gcloud compute disks resize $INSTANCE_NAME$num --size=100G --zone=europe-west3-c
done

echo "success!"
Each node has the following specifications:
- Node series E2
- Machine type e2-standard-2
- 2 vCPU
- 4GB memory
- 10 GB SSD persistent disk 910
- Ubuntu 18.04 LTS with real-time kernel activation
In a similar way, a containerized evaluation testbed is created. Docker containers are used as nodes for the benchmarking and monitoring concept instead of GCP instances. As a result, unrelated factors such as outside connection drops and router bottlenecks are eliminated from evaluation processes. Docker containers represent the network nodes, 915 while the monitoring system runs directly on the host. This allows for more accurate evaluation of the concepts. Docker provides more lightweight, agile computing resources using a container-based approach, compared with cloud computing.
Performance Evaluation
The first benchmark evaluates the stability and accuracy of the latency measurements. This is important to ensure that the eBPF-based tool is providing accurate information in real-time. This section evaluates the robustness and accuracy of the eBPF-based approach compared to legacy tools such as ping. The testbed used n devices running on separate hardware connected to the same router.
Evaluation on single node
In the first part of this test, a testbed consisting of two native machines connected to a local network is set up. The monitoring node sends 100 ping requests to Node1 at a rate of one request per 3 seconds in order to measure the round trip time (RTT) of the connection. For latency measurement, an example MetricCollector program based on eBPF is implemented similar to ping program for comparison. The test was repeated multiple times to evaluate the test results for rebustness. The figure below shows that the proposed approach using eBPF provides approximately 5 times lower latency than that of ping.
 Latency comparison of eBPF example MetricCollector with non-eBPF based solution running on testbed setup
Here’s a table with mean times collected for every iteration of the tests in milliseconds.
| Tool | Average latency [ms] | Standard deviation [ms] |
| eBPF MetricCollector | 0.179 | ±0.153 |
| ping | 0.766 | ±0.528 |
Stress-test evaluation
The next step is to stress-test the two tools, eBPF-based example MetricCollector and ping, on three different testbeds by sending large numbers of ping requests simultaneously to all host nodes from the monitoring node to n host nodes. As a first testbed, docker containers running light Linux alpine images are used. In the second testbed, virtual machines are connected by one private network running on GCP, the Google cloud service. A third testbed uses real devices connected to one physical router inside a private network. The monitoring node runs on native hardware.
| Testbed | Tool | Average latency [ms] | Standard deviation [ms] |
| GCP | eBPF MetricCollector | 0.634 | ±0.1.15 |
| GCP | ping | 3.577 | ±3.258 |
| Docker | eBPF MetricCollector | 0.747 | ±1.851 |
| Docker | ping | 3.054 | ±5.553 |
| Native | eBPF MetricCollector | 0.193 | ±0.262 |
| Native | ping | 51.134 | ±56.990 |
The table above shows that GCP and Docker produce similar results. eBPF MetricCollector provides latency measurements about 7 times faster than ping in both testbeds. The standard deviation of ping is 2 times higher in the GCP testbed and 3 times higher in the Docker testbed, respectively. Using native machines for real-world testbed evaluation, the difference in performance rises significantly. The results of eBPF remain relatively constant. However, ping measurements vary greatly.
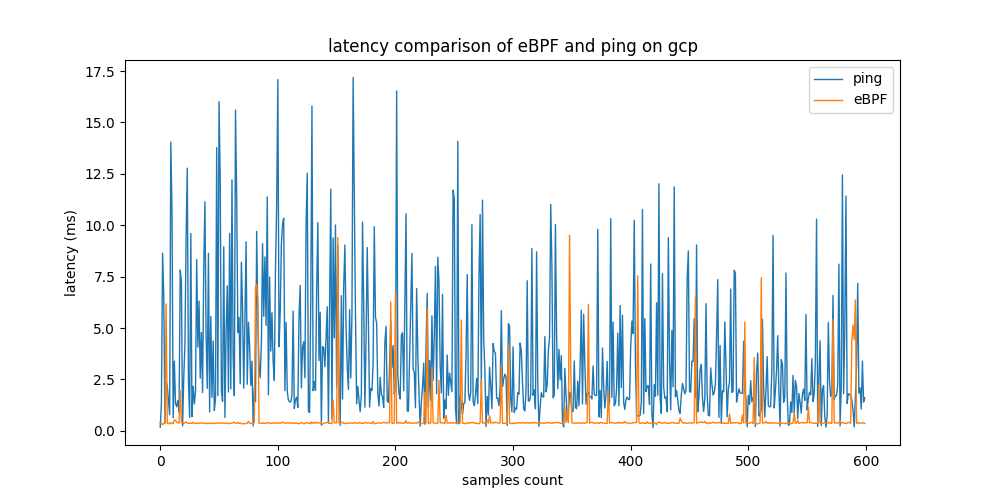
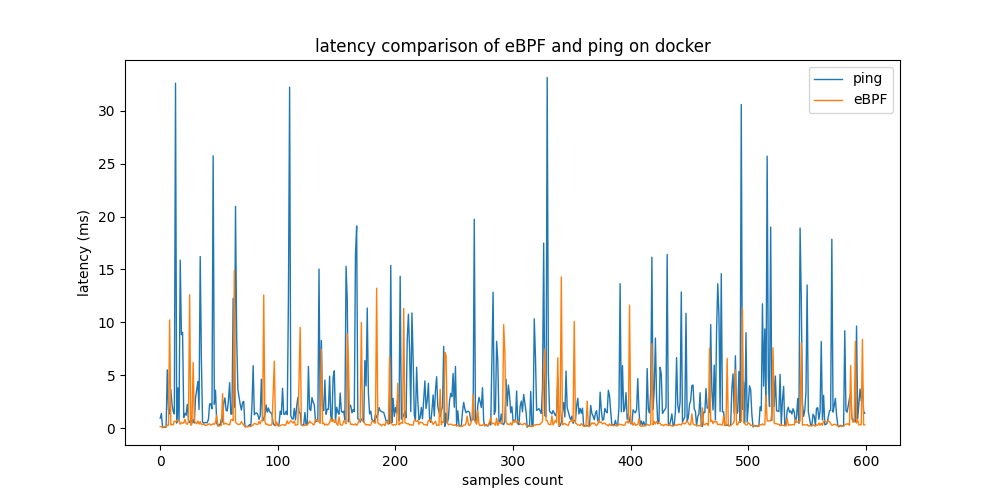
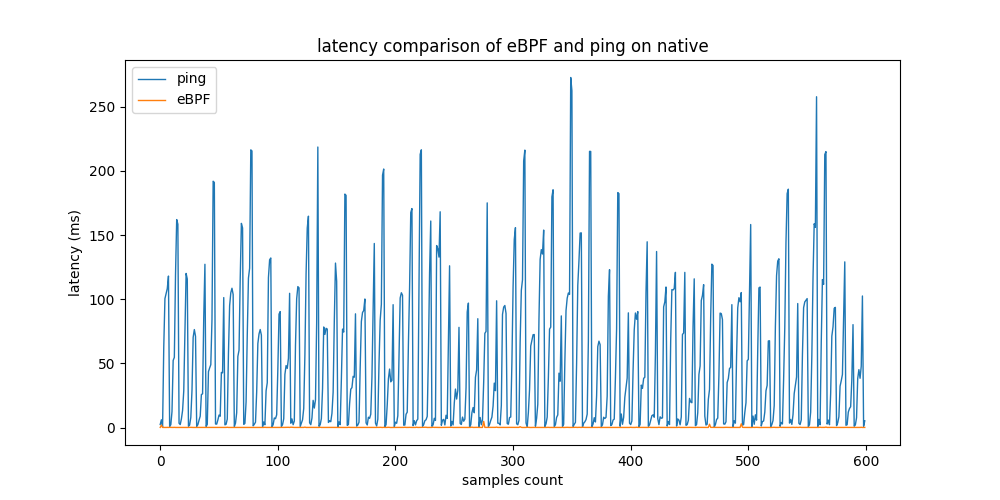
Latency measurements from the eBPF-based and non-eBPF tools on 3 testbeds
Hardware utilization evaluation
This benchmark evaluates the resources utilization of the tool. It measures how much of the system resources the concept is using in order to function. The test measures CPU utilization of the monitoring system in its entirety. The methodology and code is found in the github repository for this project.
As visualized in the figure below, prometheus uses 16.40% of the CPU, while node_exporter - a non-eBPF metrics exporter - accounts for 34.57% Meanwhile, the MetricsExporter marked in green box on the left side with the MetricCollector running in eBPF VM marked in green box on the right side use together only 5.56% of the CPU. Based on these results the MetricsExporter utilizing eBPF utilizes almost 7 times less CPU compared to node_exporter. However, node_exporter collects a greater number of metrics. Most profilers cannot trace the full stack of XDP programs. However, the XDP packet dropper running on the LLVM can still be traced on the left side marked in green.
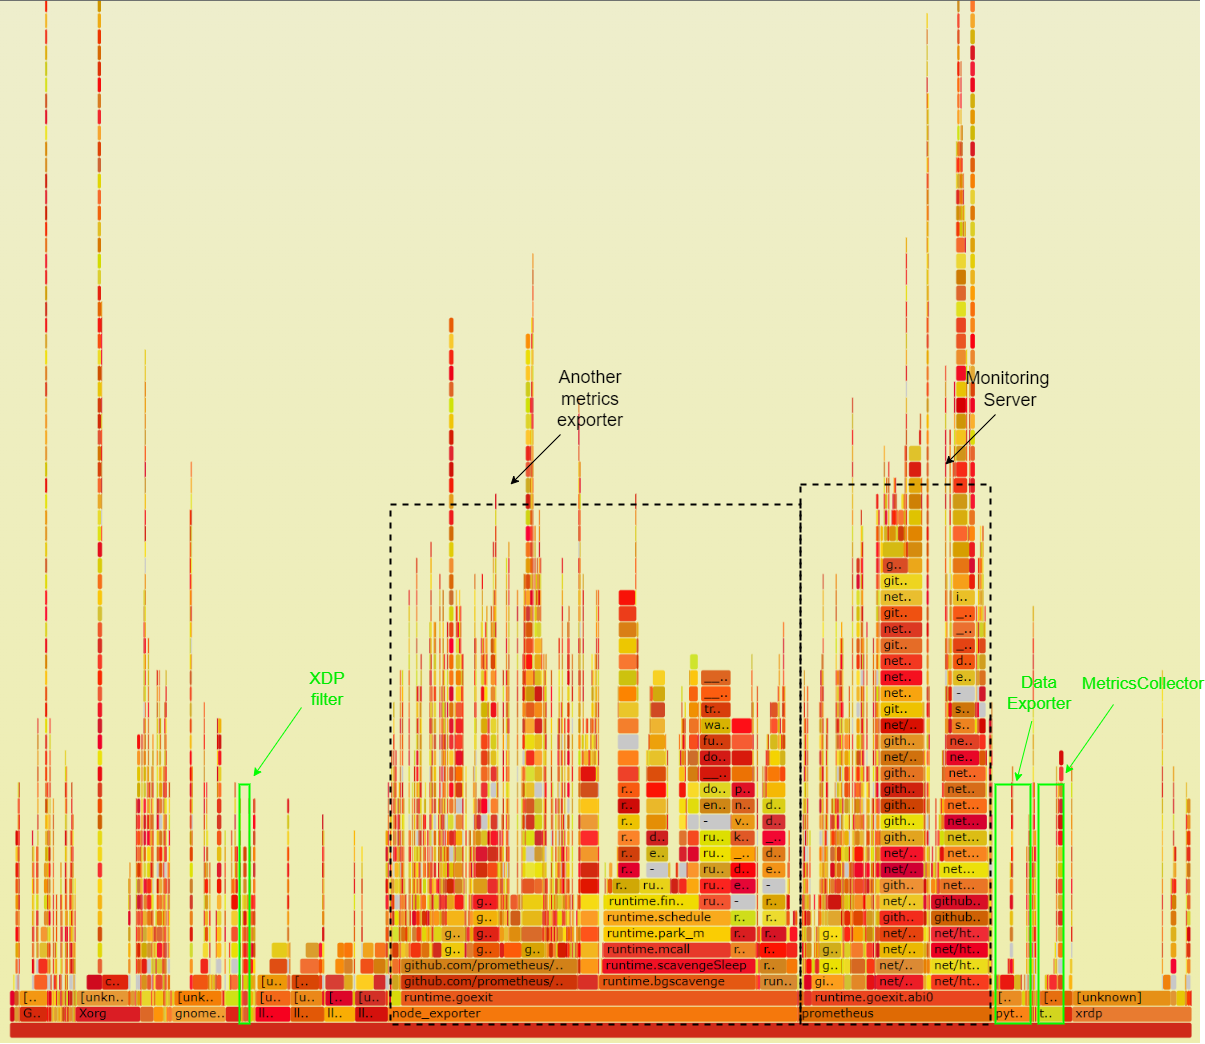 Flamegraph of the CPU utilization of the monitoring system
Conclusion
This work presented a practical software-based network monitoring system that focuses on some challenges in monitoring real-time networks by significantly reducing resources consumption and capturing network events at earlier stages. The system has been implemented and evaluated on a testbed network. The results show that the proposed system is able to process more network activities than conventional solutions. The concept of the monitoring system aims at service-oriented and containerized architecture that runs on virtual hardware, beside the data collection part that runs on the main hardware. An interface enables human-machine interactions and gives the user control over the system.
Although eBPF provides instantaneous responses from the OS, speed is not its primary feature. The idea of skipping ingress packets at the NIC driver and egress packets at the socket-level with the help of eBPF and XDP results in huge performance improvements since unnecessary computations or parts of the kernel stack are avoided.
Additionally, eBPF programs detect events earlier and more accurately than traditional approaches, resulting in more accurate information. While eBPF offers better performance overall, it can be difficult to take a proof-of-concept eBPF program and extend it to a more complex program. BCC is one way of making writing eBPF programs easier, but there is still a long way to go before making writing more comprehensive eBPF programs easy.
Important links
References
- Miano, S., Bertrone, M., Risso, F., Tumolo, M., & Bernal, M. V. (2018). Creating Complex Network Services with eBPF: Experience and Lessons Learned. 2018 IEEE 19th International Conference on High Performance Switching and Routing (HPSR), 1–8. https://doi.org/10.1109/HPSR.2018.8850758
- Scholz, D., Raumer, D., Emmerich, P., Kurtz, A., Lesiak, K., & Carle, G. (2018). Performance Implications of Packet Filtering with Linux eBPF. 2018 30th International Teletraffic Congress (ITC 30), 01, 209–217. https://doi.org/10.1109/ITC30.2018.00039
- Bertrone, M., Miano, S., Risso, F., & Tumolo, M. (2018). Accelerating linux security with ebpf iptables. Proceedings of the ACM SIGCOMM 2018 Conference on Posters and Demos, 108–110.
- Lee, S., Levanti, K., & Kim, H. S. (2014). Network monitoring: Present and future. Computer Networks, 65, 84–98. https://doi.org/https://doi.org/10.1016/j.comnet.2014.03.007